Google Sheets Canvas Transforms Spreadsheets with AI-Powered Visualization
Google Sheets has launched Canvas, an AI-powered workspace that redefines how users interact with spreadsheet data, moving beyond static grids to dynamic, interactive visualizations.
✨ This content was summarized and interpreted by AI; it may contain errors — please verify accuracy with the original sources. Learn more
Listen to this story
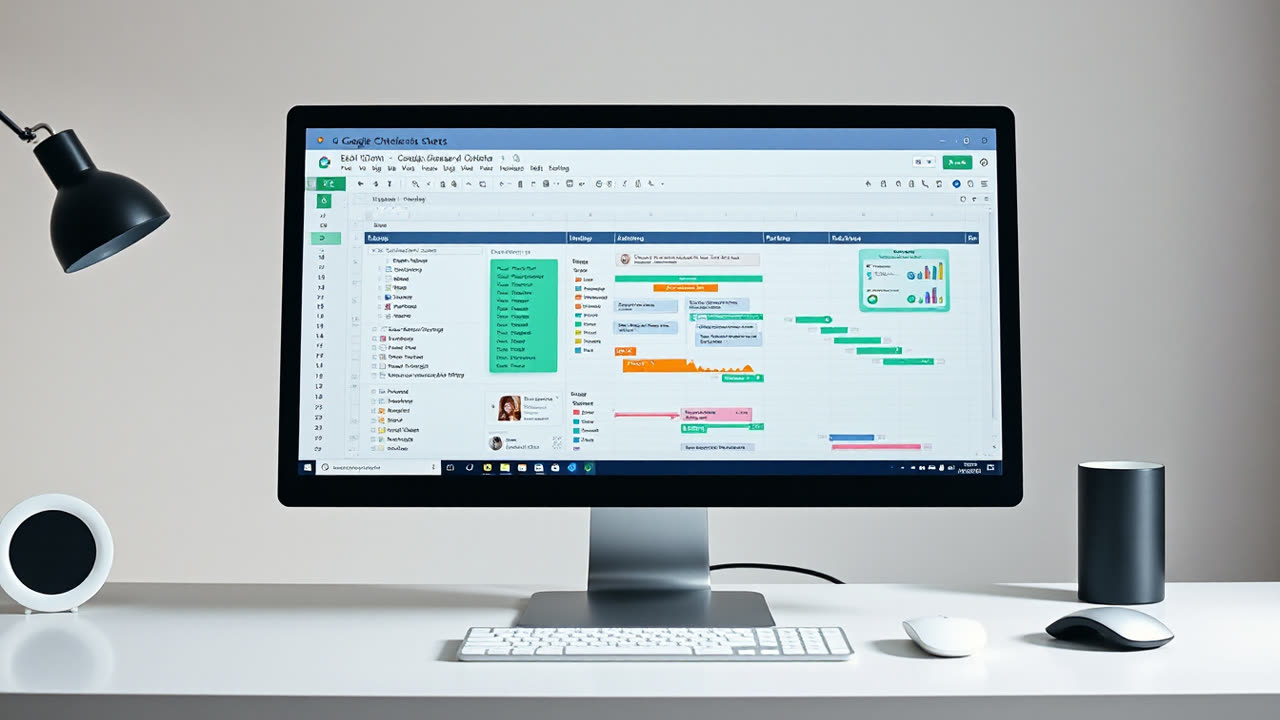
Google Sheets has undergone its most significant user interface transformation in years with the introduction of Sheets canvas, an AI-powered workspace launched at Google Cloud Next 2026 in April. This innovation fundamentally redefines how users interact with spreadsheet data, moving beyond static grids and traditional charts to dynamic, interactive "mini-apps" directly atop their information. Far from a mere charting tool, Canvas, deeply integrated with Google's Gemini AI, empowers users to generate sophisticated dashboards, Kanban boards, heat maps, calendar views, and gallery views through natural language prompts, dramatically democratizing advanced data visualization.
The core functionality of Sheets canvas lies in its ability to translate natural language commands into custom, interactive visualizations. Users simply describe their desired output, and Gemini constructs the visual layer, which remains dynamically linked to the underlying spreadsheet data. This real-time synchronization means any change in the source data is immediately reflected in the Canvas view, providing live insights. Crucially, Canvas also supports two-way interaction; for instance, dragging a card in a Kanban board to a new status column automatically updates the corresponding cell value in the sheet, blurring the lines between data entry and visualization. This capability positions Sheets not just as a data repository but as a no-code application builder, embedded within the familiar spreadsheet environment. Sheets canvas is available to all Google Workspace users, with full AI-powered generation features requiring a Workspace plan that includes Gemini access, while free Google accounts offer a more limited, manual configuration set.
This development holds profound implications for both users and the broader industry. For users, Sheets canvas significantly lowers the barrier to entry for complex data analysis and dashboard creation. Traditionally, generating professional-looking, interactive dashboards in Sheets involved laborious manual chart positioning, intricate formatting tricks, and limited interactivity, often requiring users to export data to dedicated business intelligence (BI) tools. Eric Birnbaum, Director of Product Management for Google Sheets, highlights that many knowledge workers lack the skills for advanced spreadsheet functions, and AI is "unlocking the power of spreadsheets" by taking on this difficult work. An August 2025 survey of 200 Sheets users revealed that 89% saved at least an hour per week using AI features, with 88% feeling more confident in their data analysis skills. This newfound accessibility can empower a broader segment of the workforce to derive actionable insights, fostering a more data-driven culture across organizations.
Industrially, Sheets canvas intensifies the competition in the data visualization and BI space. While dedicated BI tools like Looker and Tableau still offer greater depth of customization and fine-tuning for enterprise-level analytics, Canvas directly addresses the common user sentiment that setting up external BI tools can be "a hassle". By offering robust, interactive dashboarding *within* the spreadsheet, Google aims to capture a significant portion of the market that needs immediate, collaborative, and less-specialized visualization. This pushes Excel, the long-standing spreadsheet giant with an estimated 85% market share as of a 2023 Datanyze report, to further accelerate its own cloud-based and AI-driven visualization capabilities. While Excel excels in complex, desktop-based computational power and extensive feature sets, Sheets' strength has always been real-time collaboration and accessibility. Canvas leverages this strength, extending collaboration from data entry to dynamic data exploration.
Looking ahead, Sheets canvas is clearly in its nascent stages, described as "still evolving" following its 2026 launch. Current limitations include a primary focus on English environments, with limited official support for other languages like Japanese as of July 2026, and restricted mobile editing capabilities (currently view-only). Handling very large datasets, exceeding 100,000 rows, can also lead to slower rendering compared to traditional charts. Future iterations will undoubtedly focus on expanding language support, enhancing mobile functionality, and optimizing performance for larger data volumes. The integration with the broader "Workspace Intelligence" semantic layer, also announced at Cloud Next 2026, suggests a future where AI unifies context across all Google Workspace apps, allowing Sheets canvas to draw on information from Gmail, Drive, and Chat to create even richer, more context-aware visualizations. This trajectory indicates Google's commitment to transforming Workspace into a seamlessly integrated, AI-first productivity ecosystem, with Sheets canvas serving as a pivotal component in making data universally understandable and actionable.